
Introduction: The Power Factor Mystery Nobody Talks About (Until the Bill Arrives)
Power Factor is Leading or Lagging-Here’s something that’ll make you re think everything about your electrical system: that power meter spinning on your building’s wall? It’s probably charging you for electricity you’re not even using effectively. Wild, right?
I remember the first time an industrial client called me, panicking about their skyrocketing energy bills. Their machinery was running fine, production was steady, but their electricity costs had jumped 20% in three months. The culprit? A lagging power factor they didn’t even know existed.
Power Factor is Leading or Lagging—specifically, whether it’s leading or lagging—is like the unsung villain of energy efficiency. It’s lurking in your electrical system, quietly sabotaging your bottom line and stressing your equipment. But here’s the good news: once you know how to identify whether your power factor is leading or lagging, you’re already halfway to solving the problem.
So grab your coffee (or your multimeter, if you’re that type), and let’s dive into the surprisingly fascinating world of power factor. Trust me, by the end of this, you’ll be the most interesting person at your next facility management meeting.
What Does It Mean When Power Factor is Leading or Lagging?
Let’s start with the basics, because understanding this concept is like learning the secret handshake of electrical engineering.
Power factor is essentially a measure of how efficiently your electrical system converts supplied power into useful work. Think of it as your electrical system’s performance rating—a number between 0 and 1 (or 0% to 100%) that tells you how much of the electricity you’re paying for is actually doing something productive.
Now, here’s where it gets interesting.
Lagging Power Factor: The Industrial Heavyweight
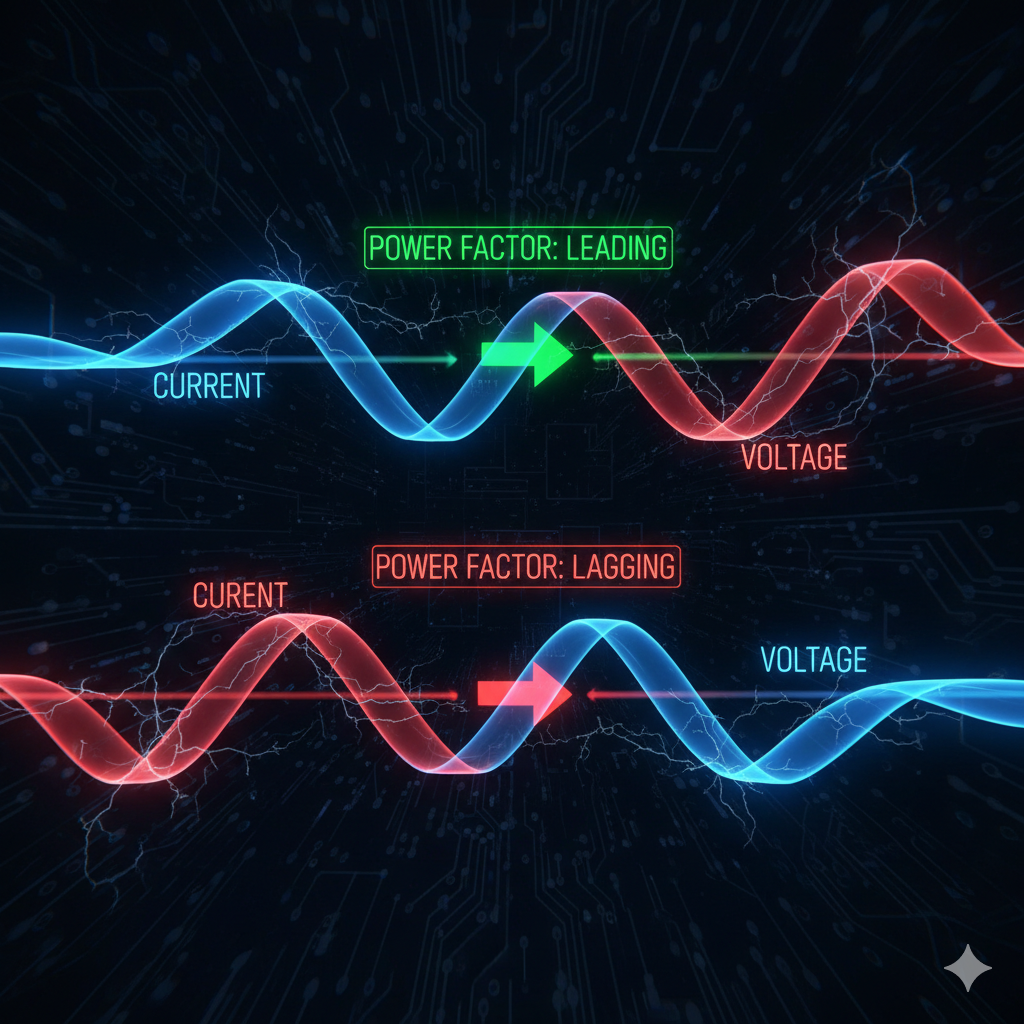
A lagging power factor happens when your current waveform falls behind (or “lags”) the voltage waveform. Picture two runners on a track—voltage takes off first, and current is trailing a few steps behind. This phase difference is what we’re talking about.
Why does this happen? Inductive loads are the usual suspects. We’re talking about:
- Electric motors (the workhorses of any industrial facility)
- Transformers humming away in your building
- Induction furnaces melting metal like butter
- Fluorescent lighting ballasts (yes, even your office lights)
- Welding equipment
- Air conditioning compressors
These devices create magnetic fields to do their work, and in the process, they demand something called reactive power. This reactive power doesn’t do any actual work—it just sloshes back and forth in your electrical system like water in a bathtub. But guess what? You’re still paying to push that water around.
Leading Power Factor: The Capacitive Rebel
On the flip side, a leading power factor occurs when current races ahead of voltage. In this scenario, current is the eager runner who jumps the gun before the starting pistol.
What causes this? Capacitive loads are responsible:
- Capacitor banks (ironically, often installed to fix lagging power factor)
- Long underground cables (they act like giant capacitors)
- Synchronous motors running under-excited
- Power factor correction equipment that’s been over-applied
- Certain electronic equipment with capacitive input filters
Leading power factor is less common in most facilities, but when it shows up, it can create its own headaches—voltage instability, resonance issues, and equipment stress.
The Phase Angle: Your Power Factor’s DNA
The relationship between current and voltage is measured as a phase angle (usually denoted by the Greek letter φ, or “phi” if you’re not into Greek letters).
Here’s the simple breakdown:
- Lagging power factor: Current lags voltage → Positive phase angle → Inductive system
- Leading power factor: Current leads voltage → Negative phase angle → Capacitive system
- Unity power factor: Current and voltage perfectly in sync → Zero phase angle → Ideal (but rare) scenario
The power factor itself is calculated as the cosine of this phase angle. So if your phase angle is 30 degrees lagging, your power factor is cos(30°) = 0.866 or 86.6% lagging.
How Can I Tell if My Power Factor is Leading or Lagging?
Alright, let’s get practical. You’ve got three main approaches to figure out what’s happening in your electrical system, ranging from “I’ve got professional equipment” to “I’m working with what I have.”
Method 1: Read Your Power Meter (If You’re Lucky)
Many modern digital power meters and analyzers will straight-up tell you whether your power factor is leading or lagging. Look for:
- A negative sign (-) before the power factor value = Leading
- A positive sign (+) or no sign = Lagging
- Text indicators like “CAP” (capacitive/leading) or “IND” (inductive/lagging)
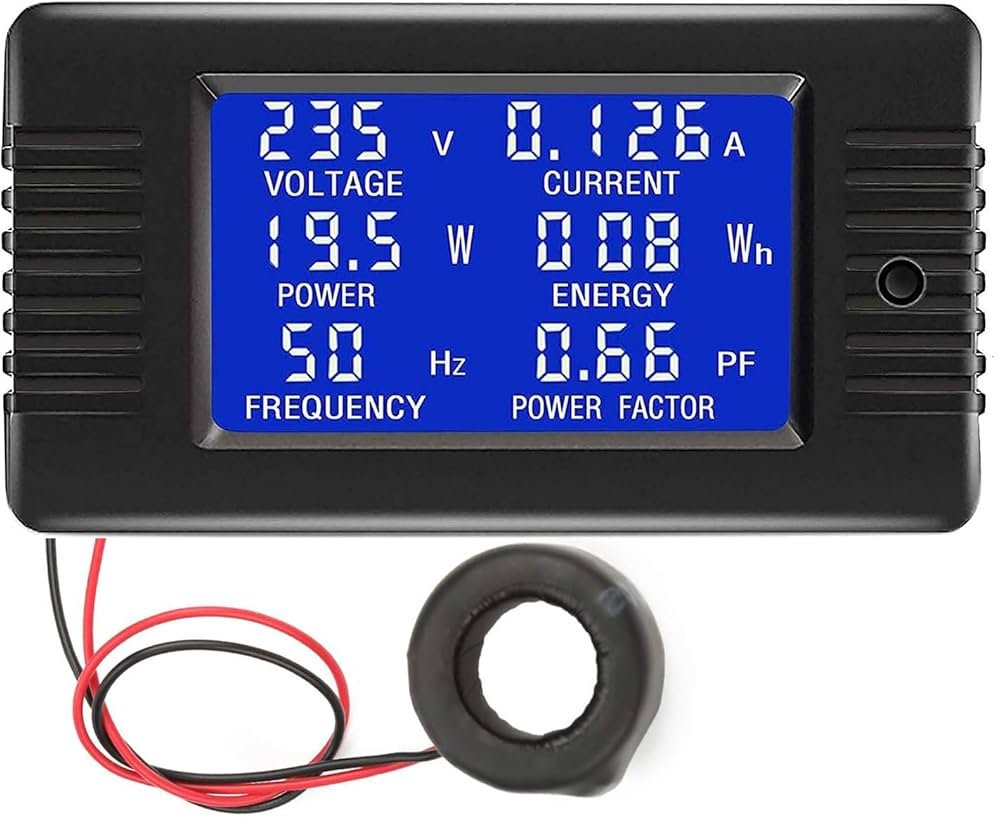
This is the easiest method, assuming your meter is sophisticated enough to display this information. If you’re staring at an old analog meter from the Reagan administration, you’ll need to dig deeper.
Method 2: Use an Oscilloscope (For the Visually Inclined)
Here’s where it gets fun if you like watching waveforms dance. An oscilloscope lets you see the voltage and current waveforms simultaneously, making the lead-lag relationship crystal clear.
Step-by-step process:
- Connect one channel to measure voltage
- Connect the second channel to measure current (you’ll need a current probe or clamp)
- Trigger the scope on the voltage waveform
- Observe where the current waveform sits relative to voltage
What you’re looking for:
- If the current waveform’s peak arrives after the voltage peak → Lagging power factor
- If the current waveform’s peak arrives before the voltage peak → Leading power factor
- If they peak simultaneously → Unity power factor (congratulations, you’ve found a unicorn)
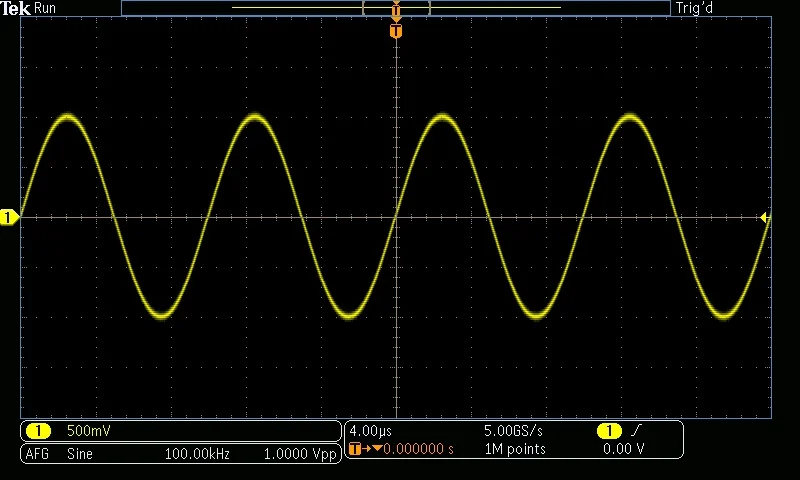
This visual method is powerful because it shows you exactly what’s happening in real-time. Plus, you can measure the time difference between peaks and calculate the exact phase angle if you’re feeling mathematical.
Method 3: Measure Reactive Power (The Detective Approach)
If you have access to a power analyzer or quality meter that measures reactive power (measured in VARs—Volt-Ampere Reactive), you can deduce the power factor type from the sign of the reactive power:
- Positive reactive power (Q > 0) → Lagging power factor (inductive)
- Negative reactive power (Q < 0) → Leading power factor (capacitive)
- Zero reactive power (Q = 0) → Unity power factor (resistive)
Think of reactive power as the “tell” in a poker game—it reveals what type of power factor you’re dealing with.
Method 4: Know Your Load (The Logical Deduction)
Sometimes, you can figure out your power factor type just by looking at what’s plugged in and running. This isn’t as precise, but it’s a quick sanity check:
Primarily inductive loads? You almost certainly have a lagging power factor:
- Industrial facility with lots of motors
- Manufacturing plant with heavy machinery
- Building with numerous transformers
- HVAC-heavy commercial space
Primarily capacitive loads? You might have a leading power factor:
- Facility with extensive power factor correction capacitors
- Long underground cable runs
- Building with over-corrected power factor equipment
Most facilities lean toward lagging because motors and transformers are everywhere in modern infrastructure. Leading power factor is the exception, not the rule.
What Tools Can Measure Whether a Power Factor is Leading or Lagging?
Let’s talk gear. Whether you’re a facility manager, electrical contractor, or just someone who likes to know what’s happening in their building, here are the tools that separate amateurs from professionals.
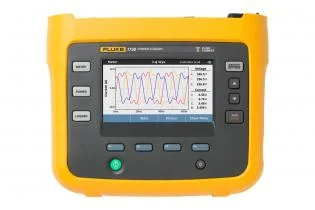
Professional-Grade Power Quality Analyzers
These are the heavy hitters—the tools that give you the complete picture of your electrical system’s health.
Fluke 434-II Power Quality Analyzer This is the Swiss Army knife of power measurement. It doesn’t just tell you if your power factor is leading or lagging; it shows you harmonics, voltage dips, swells, and basically everything happening in your electrical system. Yes, it costs as much as a used car, but for serious facilities, it’s worth every penny.
Hioki PW3360 Power Quality Analyzer Popular in industrial settings, this Japanese-engineered beauty delivers detailed phase measurements and power factor analysis. It’s built like a tank and handles harsh environments like a champ.
Dranetz HDPQ Touch The touchscreen interface makes this feel like the iPhone of power analyzers. It provides clear phase angle readings and indicates power factor type with minimal fuss. Perfect if you need to train multiple team members on power monitoring.
Portable Power Meters
These are your go-to tools for quick checks and routine monitoring.
Extech PQ3450 Power Meter This handheld device gives you real-time power factor readings with clear leading or lagging indicators. It’s portable enough to check multiple circuits during a facility walkthrough but sophisticated enough to capture useful data.
Circutor Power Factor Meter A digital meter specifically designed for power factor monitoring, with straightforward displays showing whether you’re leading, lagging, or somewhere in between. Great for permanent installation at key points in your distribution system.
Budget-Friendly Options
Digital Multimeters with Power Factor Function Some advanced multimeters now include basic power factor measurement. They won’t give you the full picture that a power quality analyzer provides, but they’re perfect for quick spot checks. Look for models that specifically indicate leading or lagging, not just the power factor value.
Power Factor Test Kits Available from electrical suppliers, these kits bundle a meter with current sensors and everything you need for basic power factor assessment. They’re the starter pack for facilities getting serious about power monitoring.
The Oscilloscope Option
Oscilloscope with Phase Measurement As I mentioned earlier, a quality oscilloscope with dual channels and current probes lets you visualize the phase relationship directly. This is more of a diagnostic tool than a monitoring solution, but it’s invaluable for understanding what’s really happening in your circuits.
Modern digital oscilloscopes can even calculate phase angle automatically, saving you from doing trigonometry on a Friday afternoon.
Permanent Monitoring Solutions
Power Factor Correction Controllers These aren’t just measurement devices—they’re active solutions. Controllers continuously monitor your power factor and automatically switch capacitor banks in and out to maintain optimal power factor. They need to know whether you’re leading or lagging to make correct decisions, so they include sophisticated measurement capabilities.
Schneider Electric PowerLogic Systems ABB Power Quality Monitoring Eaton Dynamic Power Factor Controllers
These systems provide continuous monitoring, data logging, and often connect to building management systems for integrated facility control.
What Types of Loads Cause Leading vs. Lagging Power Factor?
Understanding what creates leading and lagging power factor helps you diagnose issues before they become expensive problems. Let’s break down the usual suspects.
Lagging Power Factor Culprits (The Common Offenders)
Electric Motors: The #1 Perpetrator Walk into any industrial facility, and you’ll find motors everywhere—conveyor belts, pumps, fans, compressors. Every single one is creating inductive reactance and pulling your power factor in the lagging direction.
The worst offenders? Lightly loaded motors. A motor running at 30% of its rated capacity might have a power factor of 0.5 or worse. That’s brutal for your energy efficiency.
Transformers: The Silent Contributors Even when they’re not powering heavy loads, transformers draw magnetizing current to maintain their magnetic fields. This continuous draw contributes to lagging power factor 24/7.
Induction Furnaces and Heating Equipment These monsters create enormous magnetic fields to melt metal or heat materials. The inductive nature of their operation makes them significant contributors to lagging power factor in manufacturing environments.
Fluorescent and HID Lighting Surprised? Those magnetic ballasts in fluorescent fixtures are inductive loads. An older office building with hundreds of fluorescent lights can have a noticeably lagging power factor just from lighting alone.
Welding Equipment Arc welders are massively inductive. I’ve seen small fabrication shops with terrible power factors simply because they’re running welding equipment all day.
HVAC Systems Compressor motors, fan motors, and the reactive components in air conditioning systems all push your power factor in the lagging direction. In summer, when HVAC loads peak, so does your lagging power factor problem.
Leading Power Factor Generators (The Rare Birds)
Capacitor Banks: The Over-Correction Problem Ironically, the very equipment installed to correct lagging power factor can create leading power factor if improperly sized or controlled. This happens most often during light load periods when capacitors remain connected but inductive loads have dropped.
I’ve seen facilities with perfect power factor during the day shift (heavy motor loads balanced by capacitors) develop leading power factor at night (capacitors still running, motors mostly off).
Long Cable Runs Especially underground cables—they have significant capacitance. Major industrial sites with extensive underground distribution can experience leading power factor in sections with long cable runs and light loads.
Synchronous Motors (Under-Excited) When run under-excited, synchronous motors act as capacitors. This is rare in typical facilities but common in specialized applications.
Electronic Equipment with Power Supplies Some modern electronic equipment with capacitive input filters contributes to leading power factor, though this is usually minor compared to other factors.
Unloaded Synchronous Generators In power generation scenarios, synchronous generators running with light loads can exhibit leading power factor characteristics.
How to Use Power Factor Information to Reduce Electricity Bills
Here’s where this gets personal—your wallet. Understanding and correcting power factor issues can slash your electricity costs significantly. Let me show you how.
Understanding Power Factor Penalties
Most utility companies charge penalties for poor power factor, especially industrial and commercial customers. Why? Because you’re forcing them to deliver reactive power that doesn’t do useful work but still requires infrastructure to transmit.
Typical penalty structures:
- Power factor below 0.95: Additional charges kick in
- Power factor below 0.90: Penalties increase substantially
- Power factor below 0.85: You’re potentially paying 10-20% more than necessary
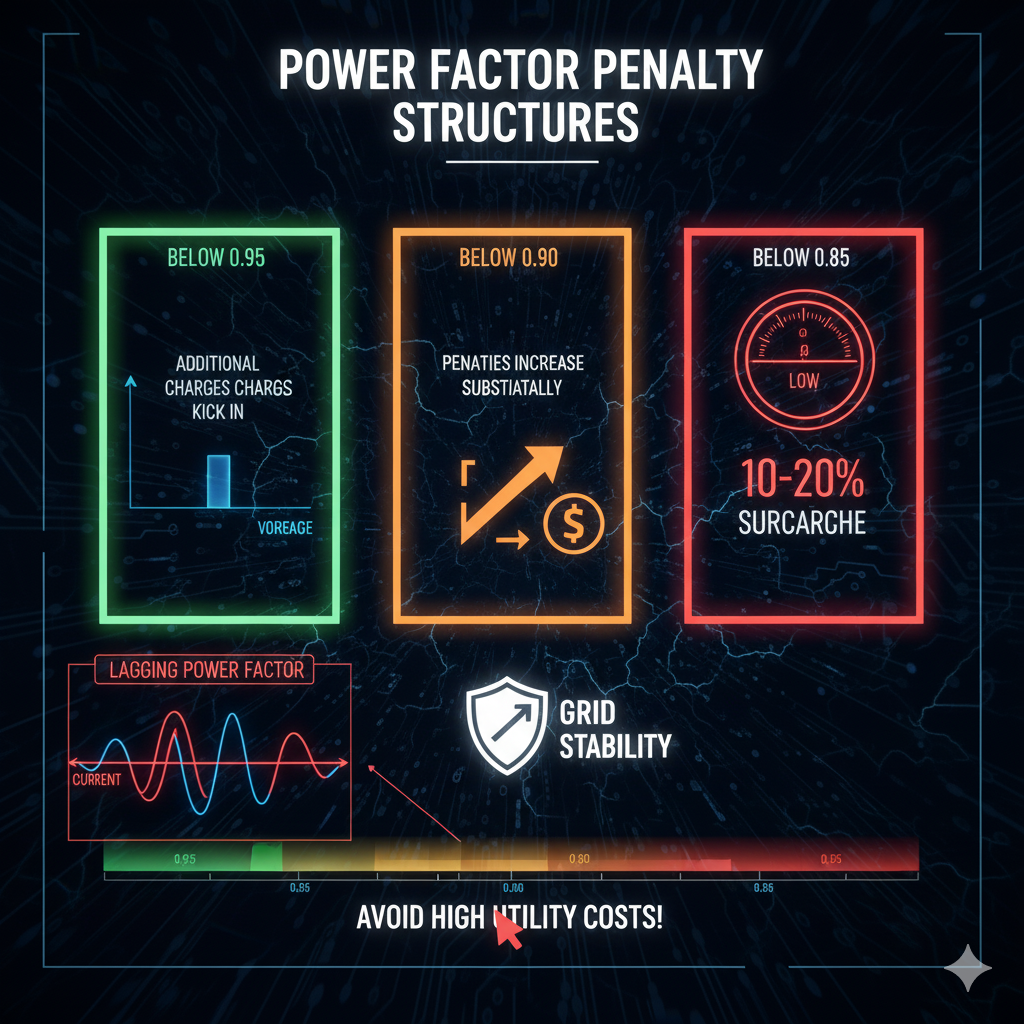
I’ve worked with manufacturing plants paying an extra $2,000-$5,000 per month just in power factor penalties. That’s $24,000-$60,000 annually—money that could be saved with proper correction.
Calculate Your Potential Savings
Here’s a quick calculation to estimate your savings potential:
Step 1: Find your facility’s average power demand (in kW) Step 2: Identify your current power factor (let’s say 0.75 lagging) Step 3: Calculate apparent power you’re being billed for: kVA = kW / power factor Step 4: Calculate apparent power after correction (target 0.95): New kVA = kW / 0.95 Step 5: Multiply the reduction in kVA by your demand charge rate
Example:
- Facility demand: 500 kW
- Current PF: 0.75
- Current apparent power: 500 / 0.75 = 667 kVA
- Corrected apparent power: 500 / 0.95 = 526 kVA
- Reduction: 141 kVA
- If demand charge is $15/kVA/month: 141 × $15 = $2,115/month savings
- Annual savings: $25,380
Correction Strategies Based on Power Factor Type
For Lagging Power Factor: The solution is adding capacitance to offset inductive reactance. Options include:
- Fixed Capacitor Banks: Simple, cost-effective for steady loads
- Automatic Capacitor Banks: Switch in/out based on load conditions
- Synchronous Condensers: Expensive but highly effective for large facilities
- Active Harmonic Filters: Premium solution that handles power factor and harmonics simultaneously
For Leading Power Factor: Less common, but the fixes are:
- Remove or Reduce Capacitance: Disconnect unnecessary capacitors
- Add Inductive Reactance: Reactors can balance excessive capacitance
- Better Capacitor Control: Automatic systems that respond to changing loads
ROI on Power Factor Correction
Most power factor correction projects pay for themselves within 1-3 years through utility bill savings alone. When you factor in additional benefits—reduced equipment stress, lower maintenance costs, increased system capacity—the payback can be even faster.
Typical costs:
- Capacitor bank installation: $50-$150 per kVAR
- Automatic power factor correction system: $10,000-$50,000 depending on size
- Professional power quality assessment: $2,000-$5,000
Additional benefits beyond bill reduction:
- Increased transformer and distribution capacity (no new infrastructure needed for expansion)
- Reduced voltage drop across your system
- Improved motor performance and lifespan
- Lower cable and equipment temperatures
- Reduced energy losses in distribution
Power Factor Correction: Devices and Solutions
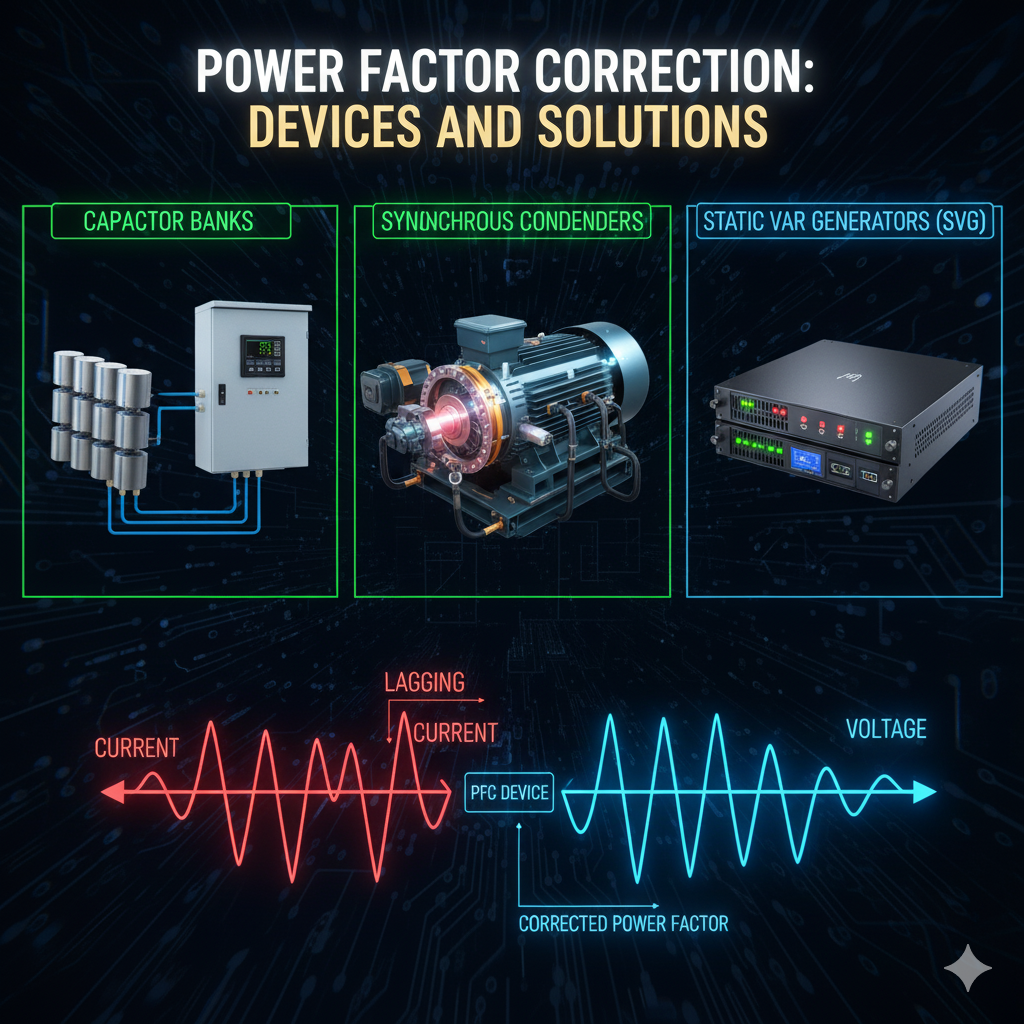
Let’s get into the hardware that actually fixes these problems. This is where theory meets reality and your energy bills start dropping.
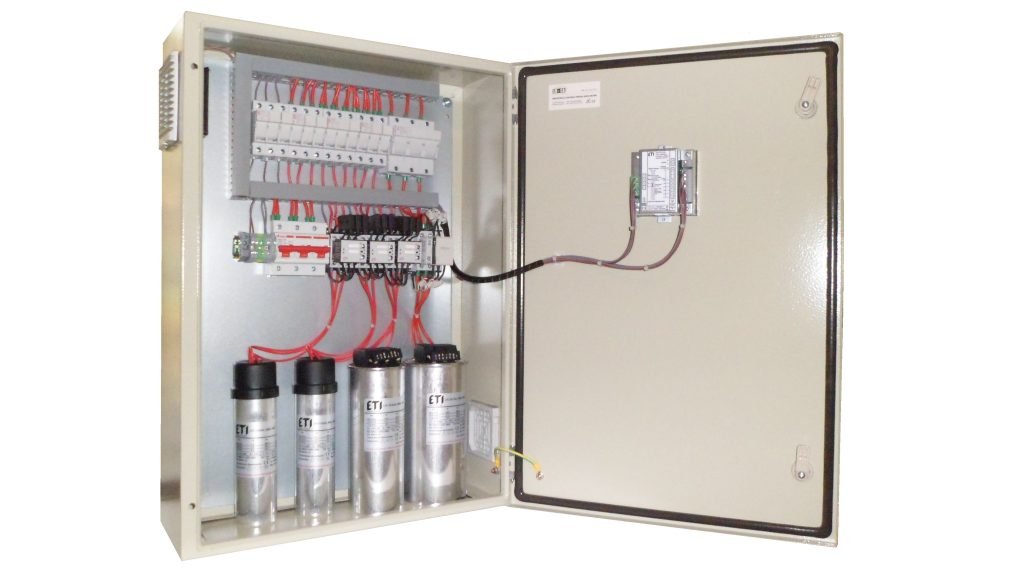
Capacitor Banks: The Traditional Workhorses
Fixed Capacitor Banks The simplest solution—permanently connected capacitors that provide constant reactive power compensation. Best for facilities with steady, predictable loads.
Top options:
- Schneider Electric PowerLogic Power Factor Correction Capacitors: Industry-standard reliability, available in various sizes
- Eaton Power Factor Correction Capacitors: Known for robust construction and long service life
- TDK Power Factor Correction Capacitors: Excellent quality-to-price ratio
When to use: Manufacturing plants with 24/7 motor loads, facilities with constant HVAC operation
Automatic Capacitor Banks These intelligent systems use controllers to switch capacitor stages in and out based on real-time power factor measurements. They adapt to changing load conditions throughout the day.
Leading products:
- ABB Power Factor Correction Panels: Sophisticated automation with excellent reliability
- Ortea Next LV Power Factor Correction System: Handles both leading and lagging conditions automatically
- Frako Power Factor Correction Systems: Complete solutions with built-in lead/lag detection
When to use: Facilities with variable loads, buildings with significant daily load cycles, any operation that needs to maintain optimal power factor across different conditions
Modern Electronic Solutions
ZDDQ Low Voltage Power Factor Corrector These reactive power compensators use feedback loops for precise, real-time power factor correction. They’re faster and more accurate than traditional switched capacitor systems.
Active Harmonic Filters The premium solution that addresses both power factor and harmonic distortion simultaneously. More expensive, but invaluable in facilities with significant non-linear loads (variable frequency drives, electronic equipment, LED lighting).
Control and Monitoring Systems
Eaton Dynamic Power Factor Controller This automated controller manages both capacitive and inductive correction, making it ideal for complex facilities that might experience both leading and lagging conditions.
Features to look for in controllers:
- Real-time power factor monitoring
- Automatic stage switching with configurable delays
- Over-voltage and over-current protection
- Data logging for trend analysis
- Communication capabilities (Modbus, Ethernet) for integration with building management systems
Software Solutions
Power Factor Correction Software Modern facilities are moving toward software-based continuous monitoring with correction recommendations. These systems:
- Monitor power factor 24/7
- Alert you to problems before they become expensive
- Track trends over time
- Generate reports for utility compliance
- Suggest optimization strategies
Sizing and Selection Considerations
Critical factors when selecting correction equipment:
- Total Reactive Power Needed: Calculate based on current vs. target power factor
- Load Variability: Fixed vs. automatic systems
- Harmonic Content: Detuned reactors may be needed in harmonic-rich environments
- Voltage Level: Match equipment to your system voltage
- Environmental Conditions: Temperature, humidity, altitude all affect capacitor selection
- Future Expansion: Leave room for growth
Common mistake: Over-correcting. Installing too much capacitance creates leading power factor, which brings its own problems. Always size conservatively and use automatic control.
Common Symptoms of Bad Power Factor (What to Watch For)
Power factor problems don’t always announce themselves with flashing lights and alarms. Sometimes you need to be a detective. Here are the warning signs I’ve learned to recognize over years in the field.
The Obvious Red Flags
Skyrocketing Electric Bills The most noticeable symptom—your energy costs are climbing despite no significant increase in production or usage. When power factor penalties kick in, they hit hard.
Power Factor Penalty Line Items Check your utility bill carefully. Many include specific charges for poor power factor, often buried in technical jargon like “reactive power charges” or “demand factor adjustments.”
Utility Company Notices If your utility is sending letters about power factor concerns, you’ve got a problem. They don’t send these for fun—they’re warning you before implementing penalties or, in extreme cases, service limitations.
The Subtle Indicators
Equipment Running Hot Poor power factor increases current flow throughout your system, causing cables, transformers, and switchgear to run hotter than necessary. If you’re noticing elevated temperatures in electrical equipment, power factor could be the culprit.
Voltage Drops Under Load When heavy equipment starts up and voltage noticeably sags, poor power factor might be exacerbating the problem. The excess current required with bad power factor amplifies voltage drop issues.
Transformer Humming or Vibrating Transformers naturally hum, but excessive noise or vibration can indicate they’re being stressed by high reactive power demands.
Breakers Tripping Without Obvious Overloads If breakers are tripping but your calculated loads seem within limits, the additional current from poor power factor might be pushing things over the edge.
Motor Performance Issues
- Motors running hotter than expected
- Reduced starting torque
- Higher-than-normal amp draw
- Premature motor failures
Flickering Lights Especially when large motors start. While this can have multiple causes, poor power factor worsens the voltage instability that causes flickering.
System-Level Problems
Reduced System Capacity You try to add new equipment or expand operations, but your electrical system can’t handle it—even though the calculations say it should. Poor power factor is consuming capacity without doing useful work.
Harmonic Distortion Issues While harmonics and power factor are different problems, they often appear together and compound each other’s effects.
Reactive Power Meters Showing High Values If your facility monitors reactive power (VARs), consistently high readings indicate you’re moving lots of reactive power that isn’t contributing to productive work.
Testing and Monitoring Best Practices
Here’s the thing about power factor: it’s not a “set it and forget it” parameter. It changes with your operations, seasons, equipment additions, and load patterns. Smart facilities monitor continuously and test regularly.
How Often Should You Test?
Initial Baseline Assessment When first addressing power factor, conduct a comprehensive assessment:
- 24-hour minimum monitoring period
- Capture typical operational cycles
- Include startup and shutdown periods
- Document seasonal variations if possible
Routine Monitoring Schedule
Daily: If you have automated monitoring systems (you should) Weekly: Manual checks of power factor readings at main service Monthly: Review trends, analyze patterns, check correction equipment performance Quarterly: Comprehensive review of power factor across all major circuits Annually: Professional power quality audit, especially before utility rate negotiations
After Major Changes Test immediately after:
- Adding new equipment
- Motor replacements or upgrades
- Facility expansions
- Changes in production schedules
- Installation or modification of correction equipment
Strategic Monitoring Points
Where to measure power factor:
- Main Service Entrance: This is what your utility sees—the most critical measurement
- Major Feeders: Large motor centers, production lines, HVAC systems
- After Correction Equipment: Verify your capacitor banks are working correctly
- Problem Areas: Circuits with known power quality issues
Data to Record and Track
Build a power factor monitoring log that includes:
- Date and time of measurement
- Power factor value and type (leading/lagging)
- Phase angle if available
- Real power (kW)
- Reactive power (kVAR)
- Apparent power (kVA)
- Load conditions at time of measurement
- Any unusual operational circumstances
This historical data becomes invaluable for:
- Identifying trends before they become problems
- Documenting improvement after corrections
- Supporting discussions with your utility
- Planning future upgrades or expansions
Tools for Continuous Monitoring
Portable Power Factor Meters for Field Use These handheld devices are perfect for routine checks and troubleshooting. They let you quickly verify power factor at different points throughout your facility without installing permanent monitoring.
Fixed Monitoring Systems For critical facilities, permanently installed monitoring at key distribution points provides continuous visibility. Modern systems can:
- Send alerts when power factor drifts outside acceptable ranges
- Log data for trend analysis
- Integrate with energy management software
- Provide remote access via web interfaces
Interpreting Your Results
Good power factor ranges:
- 0.95 to 1.0: Excellent—you’re in the sweet spot
- 0.90 to 0.95: Acceptable for most operations, though improvement would help
- 0.80 to 0.90: Poor—you’re likely paying penalties and should correct
- Below 0.80: Critical—immediate correction needed
Warning signs in your data:
- Power factor that varies wildly throughout the day suggests you need automatic correction
- Leading power factor during low-load periods means over-correction
- Gradually degrading power factor over months indicates changing load patterns or equipment aging
Harmonics and Power Factor: The Complicated Relationship
Alright, we need to talk about harmonics because they’re the troublemaker that crashes the power factor party. If you’re measuring power factor and getting weird results that don’t match your expectations, harmonics are probably the reason.
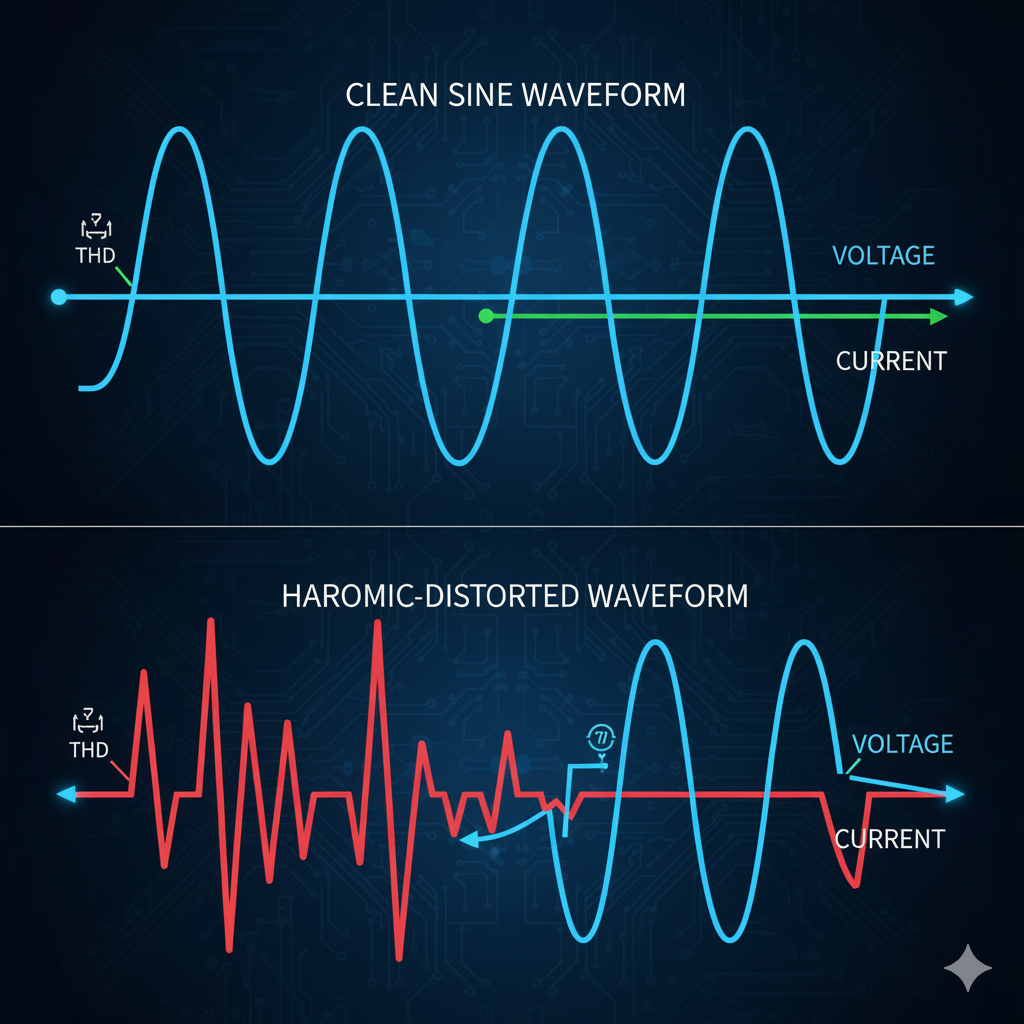
What Are Harmonics? (The Quick Version)
Harmonics are distortions in the perfect sine waves of voltage and current. They’re caused by non-linear loads—equipment that doesn’t draw current smoothly, but in choppy, distorted patterns.
Common harmonic sources:
- Variable frequency drives (VFDs)
- Computer power supplies
- LED lighting
- UPS systems
- Electronic ballasts
- Arc welders
- Battery chargers
Sound familiar? Yeah, that’s most modern equipment. We’ve traded motor-heavy facilities with clean waveforms (but terrible lagging power factor) for electronics-heavy facilities with cleaner power factor but dirty harmonics.
How Harmonics Mess with Power Factor Measurement
Here’s where it gets technical, but stick with me because this matters if you’re trying to fix power factor problems.
Traditional power factor (displacement power factor) only considers the phase relationship between the fundamental frequency (60 Hz in the US) voltage and current.
True power factor (also called total power factor) accounts for both the phase displacement AND the harmonic distortion.
When harmonics are present:
- Your meter might show decent displacement power factor (say, 0.95)
- But your TRUE power factor is actually worse (maybe 0.85)
- You’re still getting charged for poor power factor
- Traditional capacitor correction doesn’t help (and can make things worse!)
The Harmonics-Power Factor Detection Challenge
How harmonics affect detection of leading or lagging power factor:
- Distorted Waveforms: When harmonics are present, the clean sine waves become jagged, making visual determination on an oscilloscope trickier.
- False Readings: Simple meters might misidentify power factor type when significant harmonics exist. They see the distorted waveform and calculate incorrectly.
- Resonance Risks: Adding capacitors to correct power factor in a harmonic-rich environment can create resonance conditions that amplify harmonics—potentially damaging equipment.
Solutions for Harmonic Environments
When you have both poor power factor and harmonics:
- Use Detuned Capacitor Banks: These include series reactors that prevent harmonic resonance while still correcting power factor. They’re specifically designed for environments with VFDs and other harmonic sources.
- Active Harmonic Filters: The premium solution that addresses both problems simultaneously. They correct power factor while actively canceling harmonic currents.
- Proper Measurement Tools: Use power quality analyzers that can measure true power factor and distinguish between displacement and distortion power factor. The Fluke 434-II and similar devices break down the components clearly.
- Targeted Corrections: Sometimes it’s better to correct power factor locally at major loads rather than at the service entrance, especially when harmonics are involved.
Testing Strategy for Harmonic Environments
When testing power factor in facilities with electronic loads:
- Measure Total Harmonic Distortion (THD) alongside power factor
- Use meters that display both displacement and true power factor
- Check individual harmonic levels (3rd, 5th, 7th are usually the worst)
- Monitor at multiple points—harmonics can vary significantly across your facility
- Test before and after installing correction equipment to verify you haven’t created resonance
Red flags that harmonics are complicating your power factor situation:
- Power factor readings that change significantly between different meters
- Correction equipment that doesn’t improve bills as expected
- Overheating of neutral conductors (triplen harmonics)
- Nuisance tripping of breakers
- Capacitor fuse failures
Real-World Applications and Case Studies
Let me share some stories from the field. These are real situations (with details changed to protect the guilty) that illustrate how power factor knowledge translates to actual problem-solving.
Case Study 1: The Manufacturing Plant Paying Too Much
The Situation: A mid-sized manufacturing plant was paying approximately $3,800/month in power factor penalties. Their utility bill showed a consistent power factor of 0.72 lagging—terrible by any standard.
The Investigation: Using a Hioki power quality analyzer, we discovered the plant’s numerous motors (pumps, conveyors, air compressors) were the primary culprits. Many were oversized for their actual loads, running at 30-40% capacity.
The Solution:
- Installed an automatic capacitor bank system (Schneider PowerLogic)
- Replaced three severely oversized motors with properly sized equipment
- Implemented load scheduling to reduce peak reactive power demands
The Results:
- Power factor improved to 0.96
- Monthly penalties dropped from $3,800 to $150
- Annual savings: $43,800
- System paid for itself in 11 months
- Bonus: Lower motor temperatures and reduced maintenance
Case Study 2: The Over-Corrected Office Building
The Situation: A commercial office building was experiencing voltage fluctuations and equipment malfunctions. Their building management system showed leading power factor of 0.88 during evening hours.
The Investigation: The building had undergone major lighting retrofits, replacing hundreds of fluorescent fixtures (inductive ballasts) with LEDs. However, the power factor correction capacitors installed years ago for the old lighting hadn’t been removed or adjusted.
The Problem: During low-occupancy hours (evenings, weekends), with most computers and equipment off, the capacitors created excess capacitance with nowhere to go. The system had flipped from lagging to leading power factor.
The Solution:
- Installed an Eaton dynamic power factor controller
- Reconfigured capacitor banks to automatically disconnect during low-load periods
- Added monitoring at main service and key distribution panels
The Results:
- Eliminated leading power factor condition
- Maintained 0.95-0.98 power factor across all load conditions
- Voltage stability improved
- Equipment malfunction reports dropped to zero
Case Study 3: The Data Center Surprise
The Situation: A newly constructed data center expected excellent power factor due to modern power supplies with built-in power factor correction. However, utility bills showed 0.82 power factor.
The Investigation: Using a Fluke 434-II with harmonic analysis, we found:
- Displacement power factor was actually excellent: 0.98
- But total harmonic distortion (THD) was 22%
- True power factor dropped to 0.82 due to harmonics
The Key Learning: The data center’s modern equipment had good displacement power factor correction built in, but created significant harmonics. Traditional capacitor correction would have been useless (and potentially dangerous).
The Solution:
- Installed active harmonic filters at main distribution boards
- Filters corrected both harmonics and remaining power factor issues
- Implemented K-rated transformers to handle harmonic currents
The Results:
- True power factor improved to 0.96
- THD reduced to under 5%
- Eliminated utility penalties
- Reduced transformer heating by 15°C
Power Factor and Grid Stability: The Bigger Picture
Here’s something most people don’t think about: your facility’s power factor doesn’t just affect your bills—it impacts the entire electrical grid. Understanding this helps you appreciate why utilities care so much about power factor.